
S&P 500 – Trading Day of Month (TDOM) for March
Hey folks, if you’re into trading the S&P 500, you might want to check out TDOM, or Trading Day of Month. It’s a cool way to look at how the market performs on specific trading days of the month, not calendar days, to spot patterns that could help your trades.
I analyzed the S&P 500 for March over the last 15 years using this strategy: you buy at the opening price and close the position either at the first profitable open within 4 days, or if the price drops to a stop loss set at 2 times the Average True Range (ATR), which measures volatility.
The top chart shows the median returns for this strategy over 15 years, paired with the win rate for each trading day. In the middle, there’s a heatmap showing historical results for every TDOM in March. It helps you see if a seasonal pattern breaks—maybe days that used to perform well suddenly don’t.
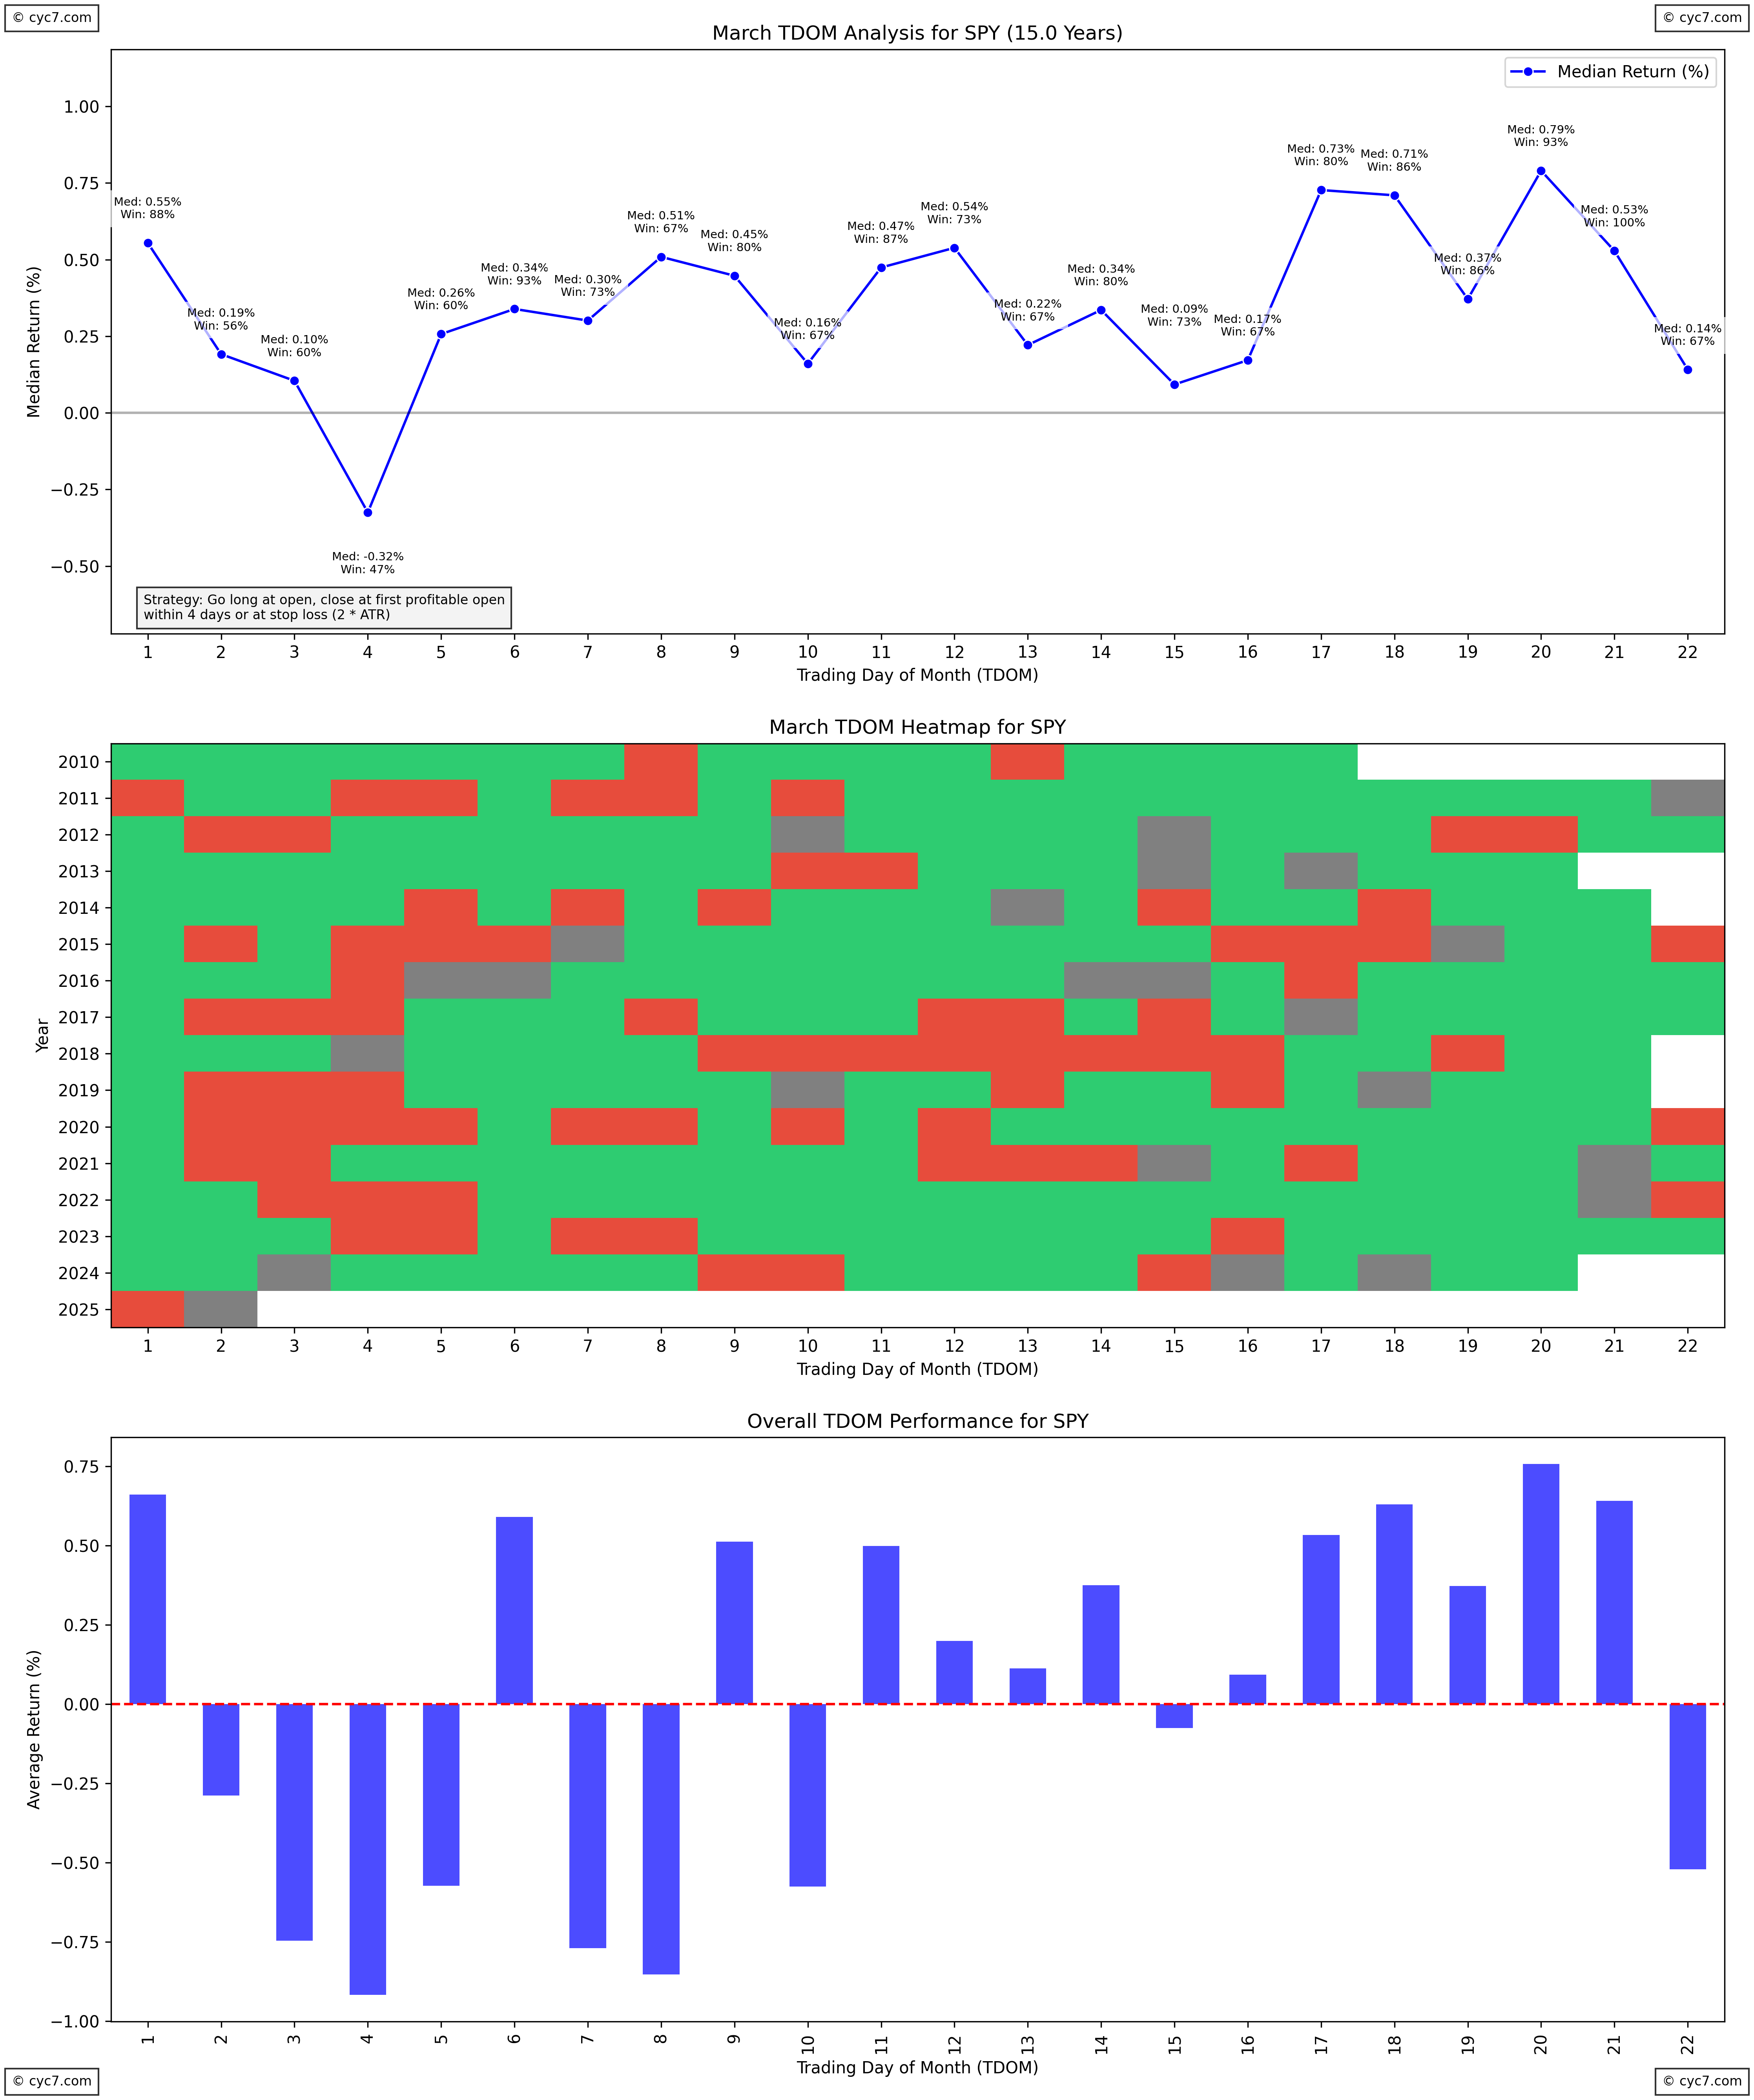
The bottom chart shows average returns, unlike the median up top. The first 10 trading days in March were pretty mixed and weak for going long, even though some days like TDOM 6 had a 93% win rate. You wouldn’t make much money going long early in the month. But by the end of March, things turn around—TDOM 17 (this year, March 25, 2025) shows strong days with solid returns and high win rates. That’s where the action is!
Give TDOM a try with the S&P 500 and see what you find for your trades!
Leave a Reply