
Hello everyone, let’s take a closer look at the gold market. The gold price has experienced a significant rally in recent months, marking a notable upward trend that’s caught the attention of many investors. However, as with any rally, there comes a point where momentum may slow, and a correction could be on the horizon. The key question is: can we predict when that might happen?
While I don’t possess a crystal ball, I’ve utilized an interesting tool from Timing Solutions software to analyze potential future movements. This approach involves comparing the current gold price pattern with historical data to identify a similar trend. Specifically, we look for a year in the past that mirrors the recent performance and use that as a basis for a forward projection.
After running the analysis, 2008 emerged as a year with a high degree of correlation to the current gold price trajectory—represented by the blue line in the attached chart. As you can see, the chart suggests that we’re approaching a potential peak. Based on the 2008 pattern, a correction could begin within the next 1-2 weeks if the trend holds true.
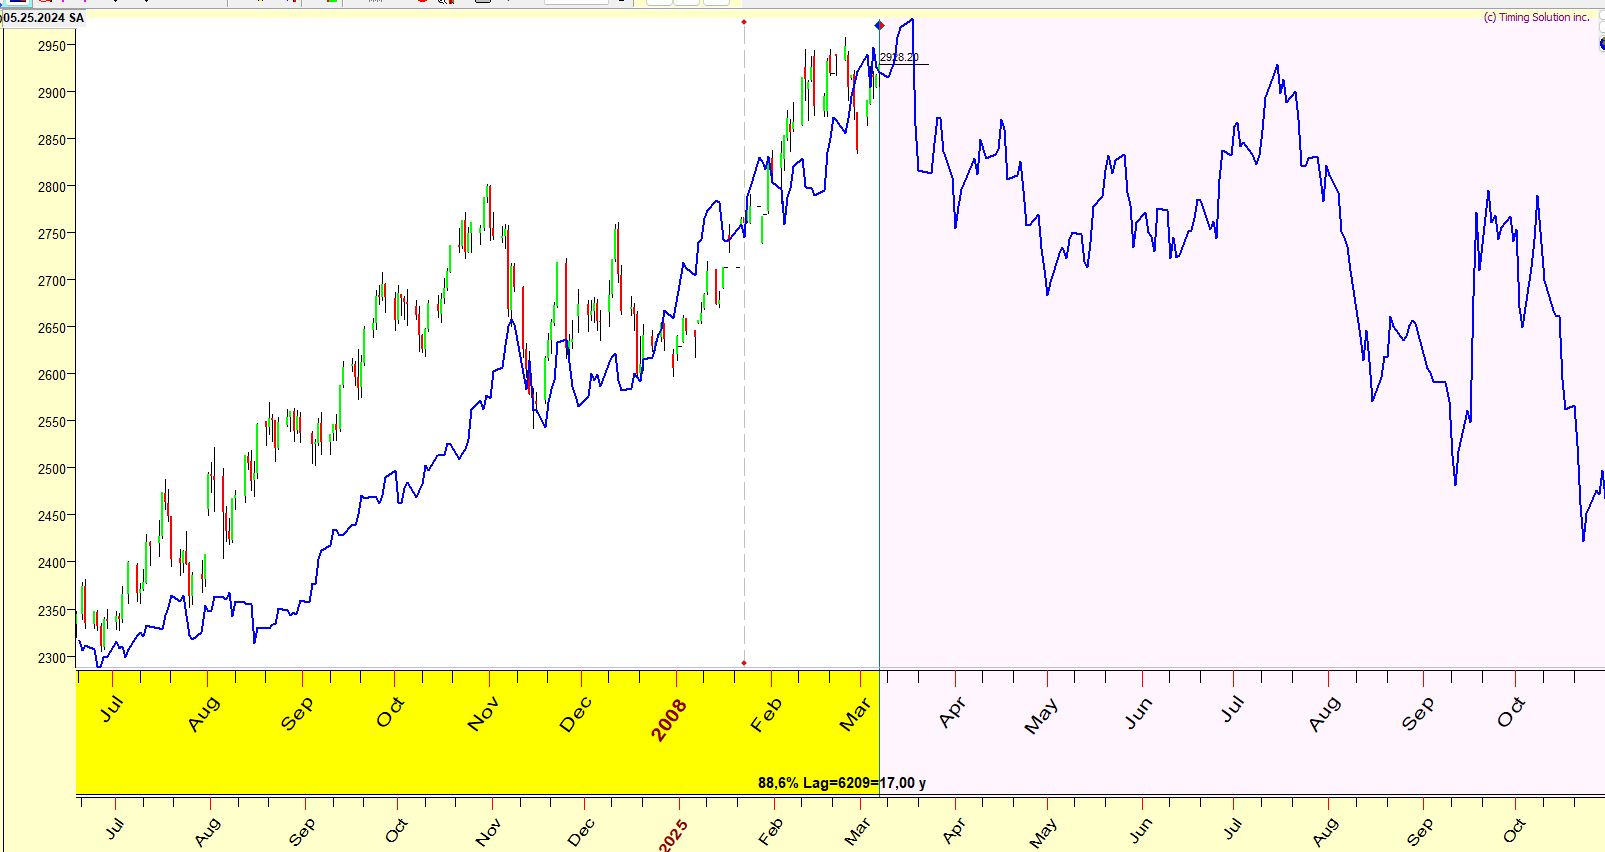
What follows after that remains uncertain. Should the model prove accurate, we might expect gold prices to either decline gradually or fluctuate sideways through the end of the year, rather than seeing a sharp drop or a continued surge.
I’m not a financial advisor, just someone who enjoys exploring market trends with the help of tools like this. The attached forecast provides a visual of this analysis, and I’m curious to see how it plays out.
Leave a Reply