
Understanding the TDOM Concept
The Trading Day of Month (TDOM) strategy, introduced by legendary trader Larry Williams, is based on the idea that certain days of the month tend to have a bullish or bearish bias in the stock market. Unlike a calendar day, which refers to a fixed date (e.g., the 1st, 15th, or 30th of the month), a trading day of the month refers to the sequence of active market days. For example, TDOM 1 is the first trading day of the month, regardless of whether it falls on the 1st, 2nd, or even later (due to weekends or holidays).
This means that TDOM patterns are adjusted for market activity, making them more relevant for traders who rely on historical tendencies. Certain TDOMs have shown a repeated bias for upward or downward movement in the S&P 500 (SPX, SPY, ES Futures), which can provide a statistical edge in timing trades.
My Approach to Testing TDOM
To analyze the effectiveness of the TDOM strategy for the S&P 500, I conducted a backtest with the following parameters:
- Entry: Go long at the market open.
- Exit Criteria:
- Close the trade on the first profitable open within four trading days.
- A stop loss is always in place, set at 2x the Average True Range (ATR).
This method allows us to measure both the win rate and median returns associated with each trading day, providing valuable insights into the statistical edge of the strategy.
Trading Individual vs. Grouped Days
While the strategy can be applied to individual trading days, another approach is to group consecutive TDOMs that show strong historical performance. By holding positions for multiple days, traders may benefit from prolonged seasonal trends rather than focusing on single-day fluctuations.
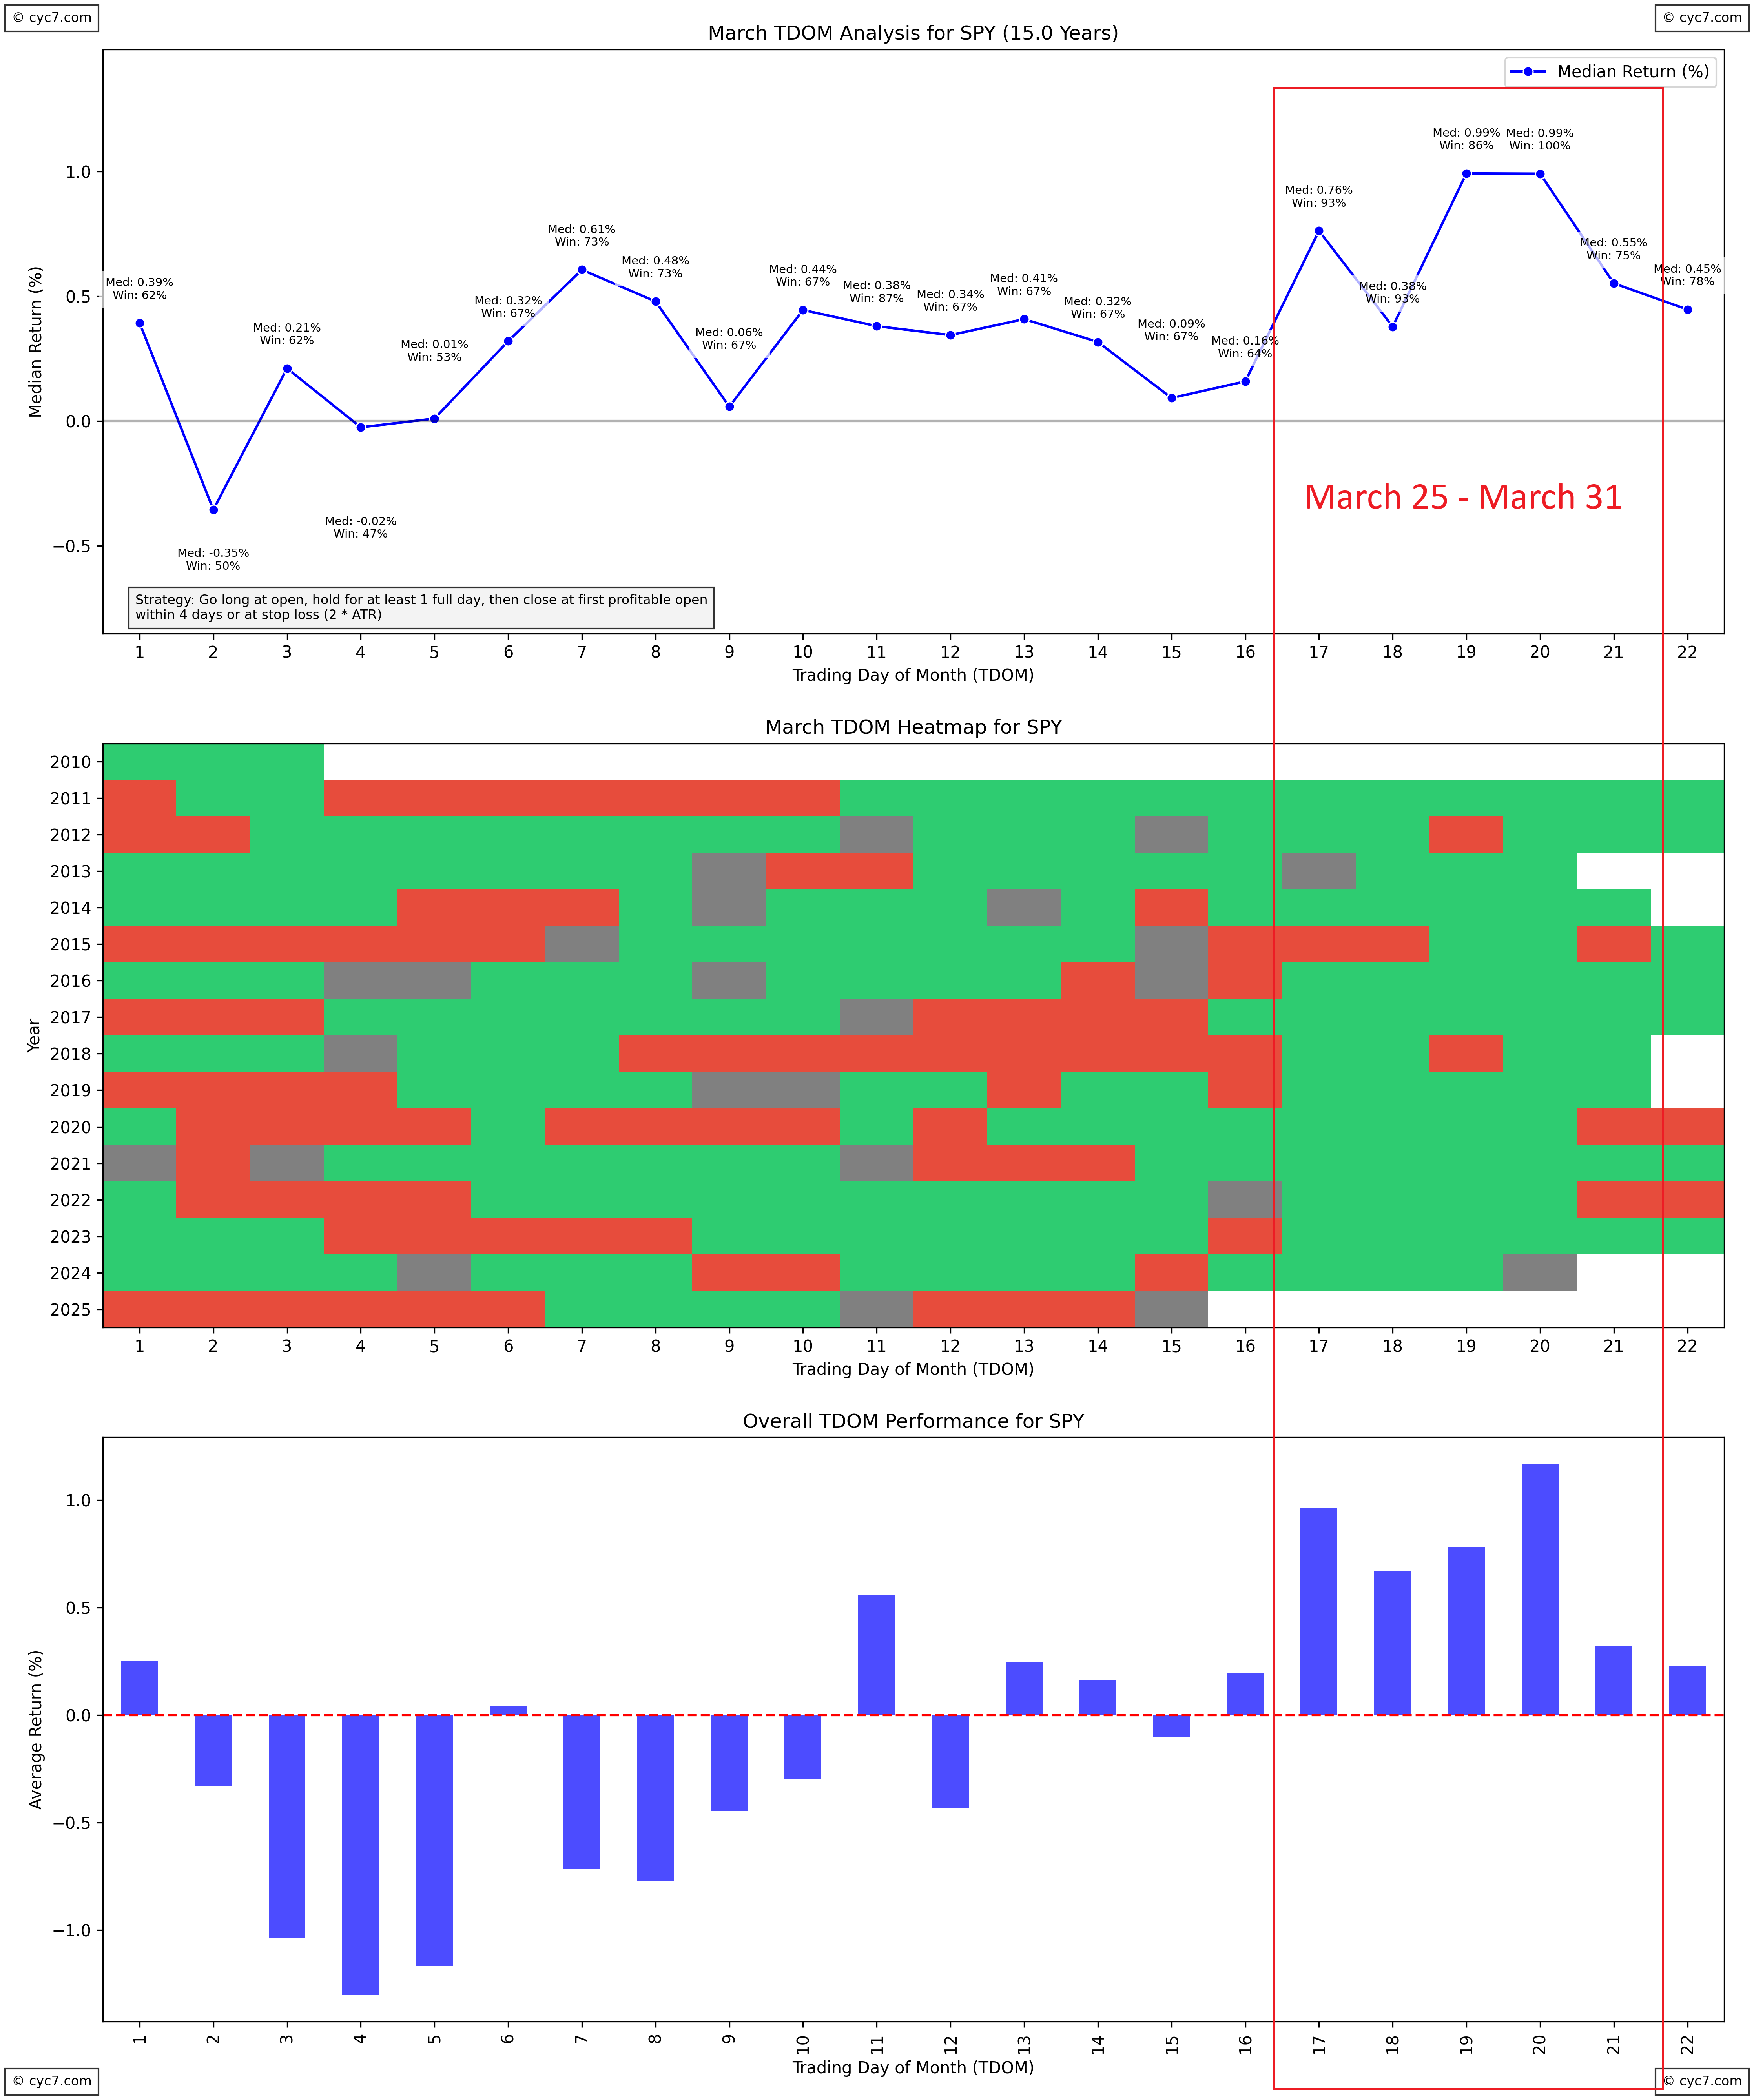
March 25 – March 31: A Strong Seasonal Period for the S&P 500
One of the most notable seasonal patterns occurs at the end of March. Specifically, TDOM 17 to 21 (which falls between March 25 and March 31 in 2024) has historically shown exceptional strength in the S&P 500. Over the past 15 years, this period has produced:
- Win rates exceeding 90%
- Median returns approaching 1%
These statistics highlight a period of strong bullish seasonality, making it a compelling time for traders to consider the TDOM strategy for SPX, SPY, or S&P 500 futures (ES).
Conclusion
From a seasonal perspective, late March has consistently been one of the strongest periods for the S&P 500. Historical data suggests that trading during this window has yielded high-probability setups with favorable returns. While past performance does not guarantee future results, understanding these seasonal tendencies can provide an additional edge in market timing.
Risk Disclaimer
Trading involves substantial risk, and past performance is not indicative of future results. The TDOM strategy, like any trading approach, should be used alongside proper risk management techniques. Always conduct your own research and consider consulting a financial professional before making trading decisions.
Leave a Reply